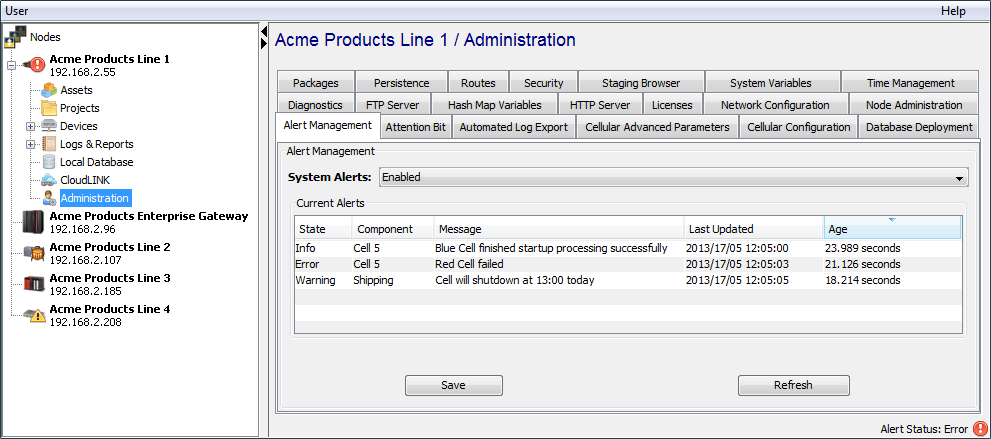
The Alert Management tab lets you view alerts for the current node. In addition, you can control whether the display of system generated alerts is enabled or disabled.
Displaying alerts for a node
The status level of an alert appears as an icon over laid on a node's icon in the Nodes list. When multiple alerts are active at the same time, the icon for the highest status level alert appears over laid on the node icon. Error is the highest level, and Debug is the lowest level.
The following shows the node icon over laid with an error alert icon (the highest level alert). The right hand pane shows the current active alerts.

Enabling and disabling the display of system generated alerts
In addition to the alerts created with the Set
Alert action, the system can also set and clear system generated alerts. The display of the system generated alerts is enabled or disabled using the Alert Management tab.

To enable or disable the display of system generated alerts, use the System Alerts parameter.
| Value | Description |
|---|---|
| Enabled | System generated alerts will be displayed on the Alert
Management tab.
Alerts generated with the Set Alert action are not affected by this setting. Active system alerts that were not displayed because of a previous parameter setting of Disabled are not displayed. Only system alerts generated when the parameter is set to Enabled are displayed. |
| Disabled | New system generated alerts will not be displayed.
System alerts that were already displayed will remain displayed until the system component clears them. |
Once you select Enabled or Disabled, select Save for changes to take effect.
The Current Alerts table displays the current active alerts. The columns are sortable, by selecting the column heading. The columns can also be reordered by dragging and dropping to a new position in the table.