The Variables tab provides the ability to Watch the current value of device variables. You must have read access to watch the value of a device variable.
A watched variable is displayed in the Variable Watch window, where the displayed value will be updated whenever the variable is updated.
To watch the value of a device variable, follow these steps:
- From Workbench left pane, expand the node whose
device's variables you want to watch.
- Select Devices.
- From the right pane, select the
Variables tab.
The Variables tab appears as the right pane. - From the appropriate device, select the plus sign
to expand the device's internal structure and variables
to locate the device variable whose value you want to
read.
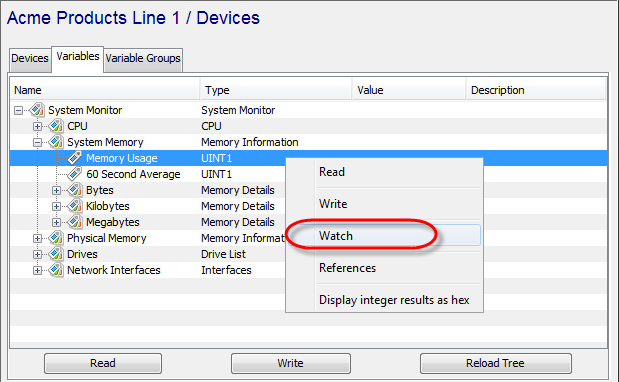
- Select the device variable, display its pop-up
menu, and then select
Watch.
- The Variable Watch window will be
displayed, showing the current value of the variable
and when it was last updated. Value changes to the
variable will be automatically displayed in this
window.
For this example, the device variable Memory Usage with an UINT1 data type is watched. The current value of the device variable is displayed in the Value column in the variable panel as well as the watch window (see below).
Watching multiple device variables at one time
Multiple device variable rows can be selected and watched at one time by using the pop-up menu Watch option.
If non readable rows are selected, such as a Device row or a structure row, the rows are ignored and only the readable rows are actually added to the watch list.
Watching device variables as a different data type
The device and its variables shown in the example support the watching of device variables as a different data type. All devices do not support this function.
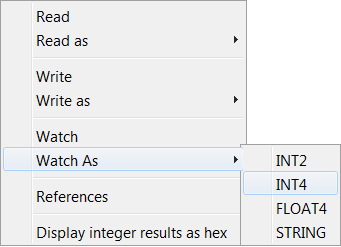
In the pop-up menu, you can also select Watch as to have the supported alternative data types displayed. In this example the data types are: INT2, INT4, FLOAT4 and STRING.
When you use the Watch as function, the
device driver reads the values of variables starting at the
current variable address for the length implied by the
selected data type.
For example, using Watch as INT4 on device variable INT2 would read 2 2-byte WORDS and display the value as a single 4-byte INT4.
Understanding of the device's variable types (registers, tags, coils, inputs, and outputs are some examples of device specific terminology), the device's variables data types, and the device's variable addressing concepts is imperative when using the Watch as function.
Watch Window
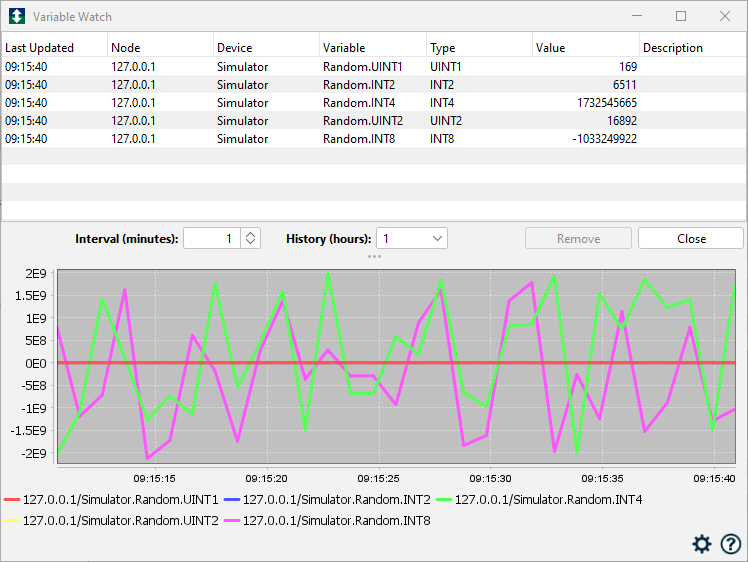
The watch window consists of a table of all the variables currently being watched and a live graph of those values.
Watched variables do not have to all be on the same node or device.
Variable Table
Each row in the table will show the following:
- Last time it was updated
- Node where the variable resides. For a network scan an IP address is displayed. For a TR50 scan, a thing key is displayed.
- Device name
- Variable name
- Type being watched, which can differ from the base type if Watch as had been selected
- Current value.
- Description if it was defined.
The table has a context menu with the following options:
- Remove - remove selected variables from watch
- Select All
- Export All - exports the watch list
- Import - import a watch list
- Display integer results as hex - applies to all integer variables being watched
- Set Deciminal Precision - set precision for all float/double values
- Close - close watch window
Options Panel
- Interval - Width of the trend graph view window in minutes. If there is not enough data to fill this interval, it will be shrunk to amount of available data. Once it exceeds this amount a scrollbar will appear.
- History - Amount of data to retain in the trend graph, in hours.
- Remove - Remove the selected variables from the watch window (stop watching).
- Close - Close the watch window.
Trend Graph
The live trend graph displays the historical data for the variables being watched. The graph shows all variables if nothing is selected in the table, or only the selected values when rows are selected. It updates at a one second rate.
Moving the mouse over the graph will display the values for that point in time in a flyover panel.
The mousewheel controls increasing and decreasing the size of the interval displayed.
If the available data is larger than the view interval, a scrollbar will appear which can be used to scroll back through history. You can also press mouse button 1 and drag the graph itself to accomplish this.
The graph context menu has the following options:
- Copy - Copy the graph to the clipboard
- Save As... - Save the graph as one of the specified file formats
- Print - Print the graph
- Export to CSV - Export the graph data to a CSV file
Settings Icon - The gear icon allows for setting the graph scaling:
- Automatic - If graph values get above a range of 250K, the scale will become logarithmic, otherwise it will be linear.
- Linear - linear scaling
- Logarithmic - logarithmic scaling
The window can remain open in the background while other tasks are performed in the Workbench. Updates to the variable values will occur regardless of the window being active. If the window is closed all watches will be stopped.