Gauge
| Description | Tabs |
|---|---|
The gauge widget provides a streamlined way to create a dashboard-like interface and display data on a semi-circular gauge. The appearance of the chart is fully configurable. Define custom colors to be used in the chart . It is possible to set one fixed color or choose different colors for a particular range of displayed values.Gauge charts are used to represent a situation in which a container may be either full or empty or somewhere in between.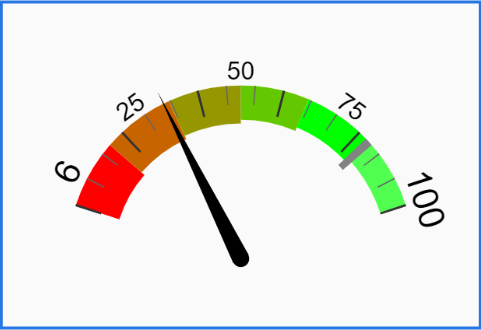 |