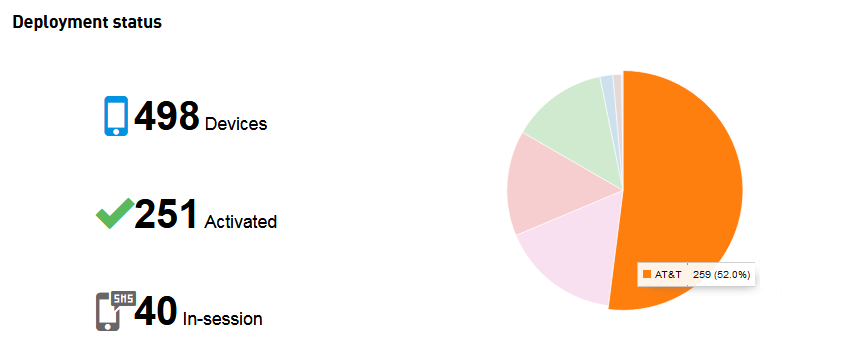
When you click on the Deployment status widget, an expanded view with additional information is displayed.
The Deployment status pie chart displays the distribution of cellular devices per carrier. When you hover your mouse over a segment, the number and percentage of devices for each carrier is displayed.
The total number of cellular devices in each of the statuses is displayed:
- The number of cellular devices
- The number of Activated cellular devices
- The number of cellular devices that have been In-session in the last 24 hours
The State changes bar chart displays
the cellular device state changes for the last 30
days.
When you hover your mouse over a date, the number of state
changes is displayed.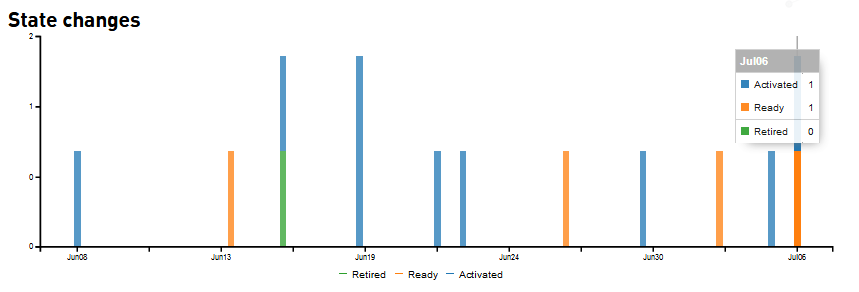
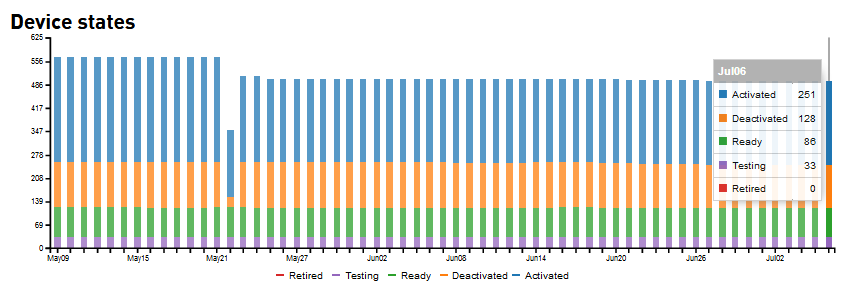
The Device states bar chart displays
the cellular device states for the last 30 days.
When you hover your mouse over a date, the number of
cellular devices in each state is displayed.