When you click on the Usage widget, an expanded view with additional information is displayed.
Each graph shows the data usage and it is possible to
filter it to show the last day, week, or month, by clicking
an option in the 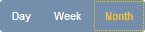 selector control:
- Day: The last day shows information for every hour for yesterday
- Week: The last week shows every day in the last 7 days
- Month: The last month shows every day in the last 30 days.
The Data traffic bar chart displays the
total data traffic for the given time period.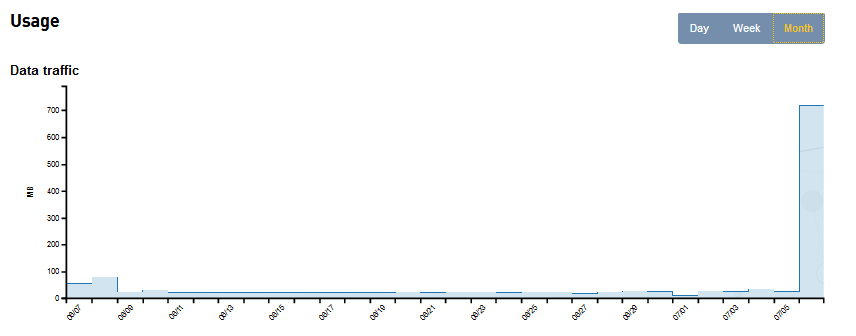
The Data sessions bar chart displays
the number of data sessions for the given time
period.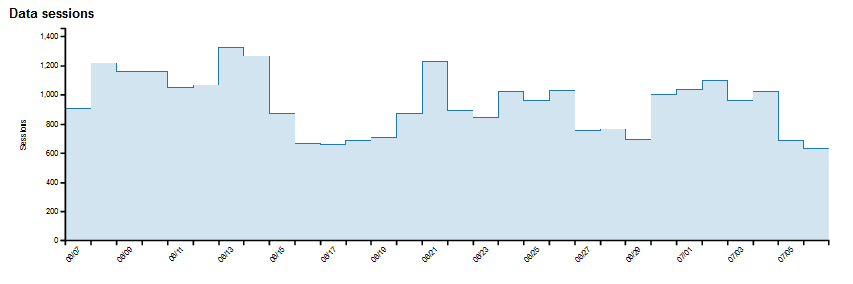
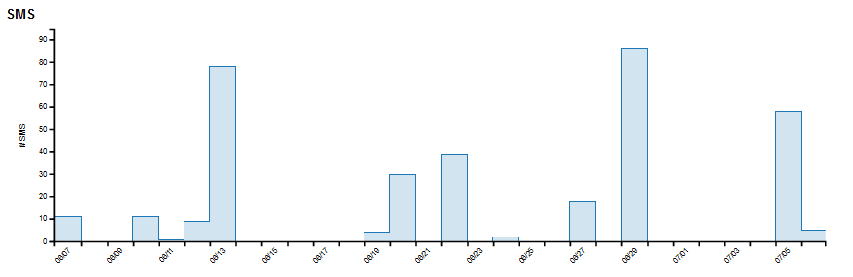
The SMS bar chart displays the number
of SMS messages for the given time period.