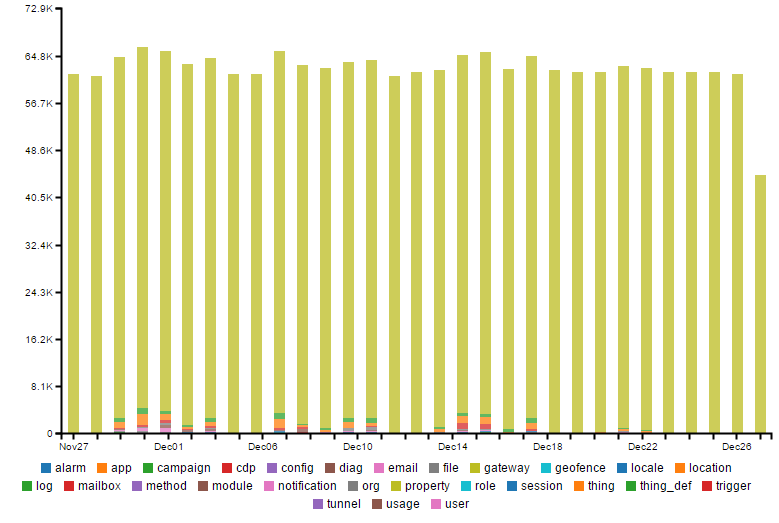
Displays a bar graph, by specified unit, of API counts
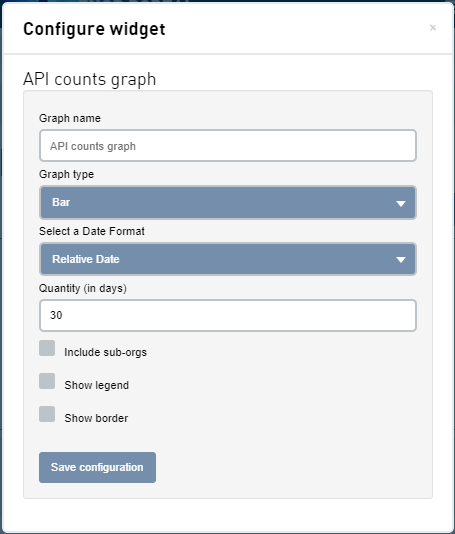
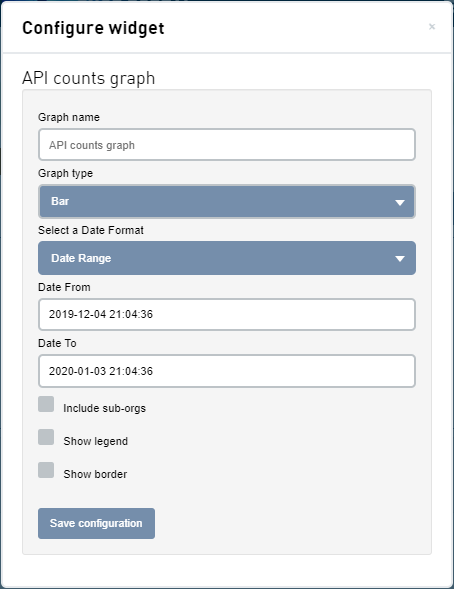
Configuring the widget
| Configuration with Relative date | Configuration with Date range |
|---|---|
|
|
| Field | Description |
|---|---|
| Graph name | Enter a name for the graph |
| Graph type | Select the type of graph |
| Select a Date Format | Relative date (e.g. last 30 days), Date range (e.g. 2019-12-04 21:04:36 to 2020-01-03 21:04:36) |
| Quantity (in days) | (Relative date) The quantity of the unit time to display in days (e.g. 30) |
| Date From | (Date range) The start date to display |
| Date To | (Date range) The end date to display |
| Include sub-orgs | Include sub organizations in the API counts |
| Show legend | Show the legend for the colors of the graph |
| Show border | Show a border around the widget |
Interacting with the widget