The Connection health pie chart is used to display a visual summary of the statuses of connections, and the number of connection in each status.
Configuring the widget
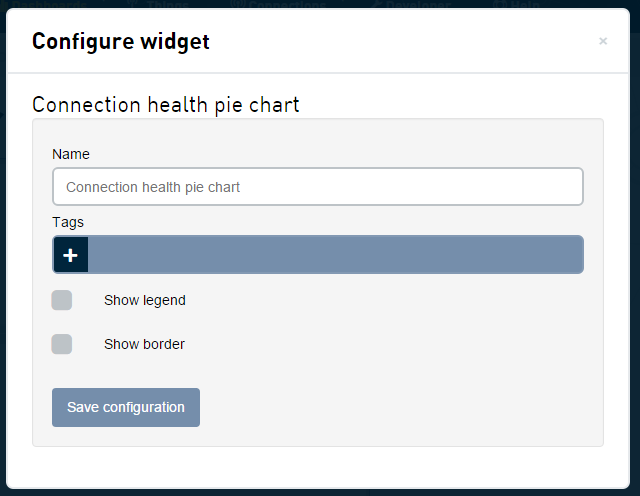
| Field | Description |
|---|---|
| Name | The name of the widget, shown at the top of the widget. |
| Tags | A list of tags used to limit the connections that are used in the pie chart. |
| Show legend | If a legend should be displayed at the bottom of the pie chart. Clicking on the color in the legend will toggle if that slice is displayed in the chart. |
| Show border | If the widget should have a border around it. |
Interacting with the widget
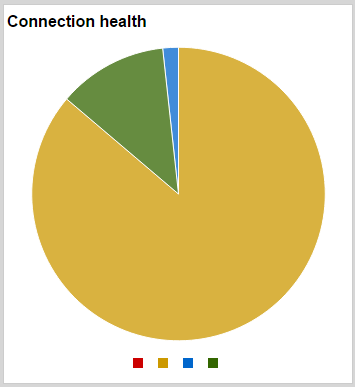
- When you mouse over a slice, the pie chart will highlight that slice and display the name of the status, the number of connections that have that status, and the percentage of selected connections that are in that status.
- If you are displaying the legend, moving the mouse over a color in the legend will highlight that slice. Clicking on the color in the legend will toggle the slice on and off in the chart.