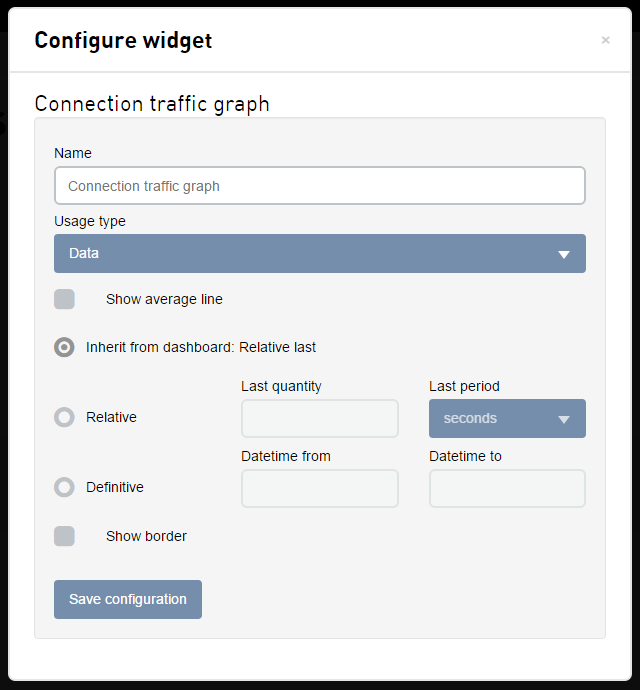
The Connection traffic graph is used to show the aggregation of usage for connections.
| Field | Description |
|---|---|
| Name | The name of the widget, shown at the top of the widget. |
| Usage type |
The usage type of the traffic to display.
|
| Show average line | If the average of the usage traffic should be displayed on the graph. |
| Relative | If the widget should display a relative historical time period (the last 7 days, for example). |
| Definitive | If the widget should show the usage for a specific date and time range. |
| Show border | If the widget should have a border around it. |
Interacting with the widget
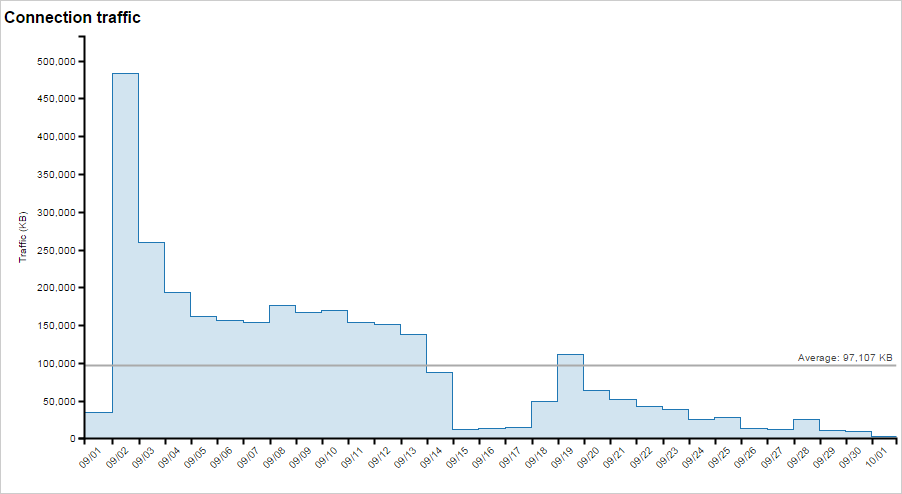
- When you mouse over the line over the graph a tool tip will be displayed showing the date/time, color, traffic size unit, and traffic value.