The presentation defines how the thing's properties are displayed in graphs. To define the Presentation values, do the following:
- From the Developer main screen in
the THINGS group, click Thing
definitions.
The Thing definitions screen appears. - Click on corresponding edit button
 of a Thing
definition you want to edit. For more information on
viewing a Trigger, see Editing a
Thing definition.
of a Thing
definition you want to edit. For more information on
viewing a Trigger, see Editing a
Thing definition.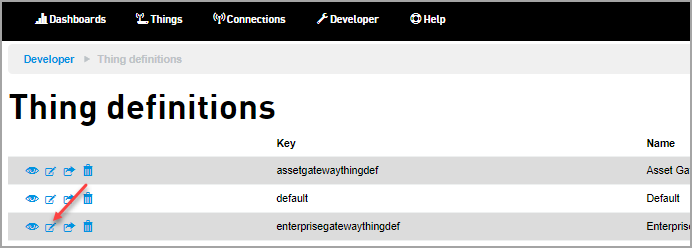
Editing Thing definition screen appears. - Click on the Presentation Tab to
define the values.
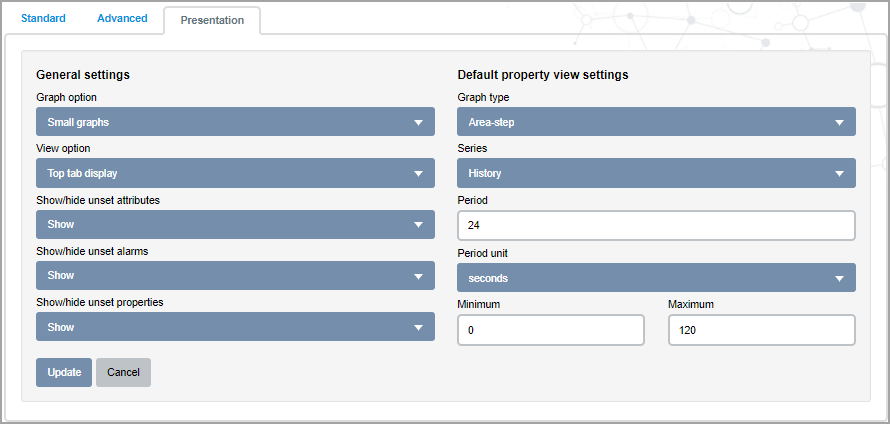
- Enter or select the fields for the presentation
characteristics. The fields are:
Field Description Graph option Controls the size of the graphs displayed on the thing's page.
The options are:- Small graphs
- Large graphs
Graph type Controls how the data is represented on the graph. The options are:
- Line
- Spline
- Step
- Area
- Area-spline
- Area-step (default)
- Bar
- Points
View option Controls the position of the tabs on the thing's page.
The options are:- Top tab display - the tabs are displayed across the top of the thing's page.
- Left tab display - the tabs are displayed on the left hand side of the thing's page.
- Single page display - the data for the thing is displayed on a single page, without using tabs and separate pages.
Show/hide unset attributes Controls if the unset attributes are shown on the thing's page Attributes tab. The options are:
- Show
- Hide
Show/hide unset alarms Controls if the unset alarms are shown on the thing's page Alarms section. The options are:
- Show
- Hide
Show/hide unset properties Controls if the unset property graphs are shown on the thing's page Properties section. The options are:
- Show
- Hide
Series Controls the aggregation of the property's values.
The options are:- Hour - the property's values are displayed by the hour, based on the Calculation field.
- Day - the property's values are displayed by the day, based on the Calculation field.
- History - all values for the property are displayed.
Calculation Displayed when the Series field is Hour or Day.
Controls the aggregation of the property values.
The options are:- Average
- Count
- Max
- Min
- Non-zero time weighted average
- Sum
- Weighted average
Period The value used based on the Period unit field. Period unit The options are: - seconds
- minutes
- hours
- days
- records
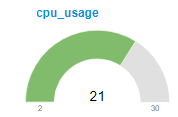
Min/Max Enter the minimum and maximum values you want to set to your properties. For example: The below example shows how the graph will be displayed for the property values set to the min. value of 2 and the max. value of 30.