When a system component experiences an exception
condition or event, it is recorded in the Exception
Log.
These events can be informational or error in nature, for
example:
- The node is started (with the node version level)
- A device has a communication problem
- A trigger is disabled
- A transport has a problem communicating with a database server.
Triggers can add messages to the Exceptions Log file using the Log Message action.
The Exceptions Log and Audit Log are managed to a set size by the system. When that size is reached, older entries are automatically deleted.
Viewing the Exceptions Log
You can access a node's Exceptions Log as
follows.
- From the Workbench left hand pane, expand the node
whose log information you want to view.
- Select the Logs & Reports
icon.
- From the right hand pane, select the
Exceptions Log tab.
The Exceptions Log tab appears.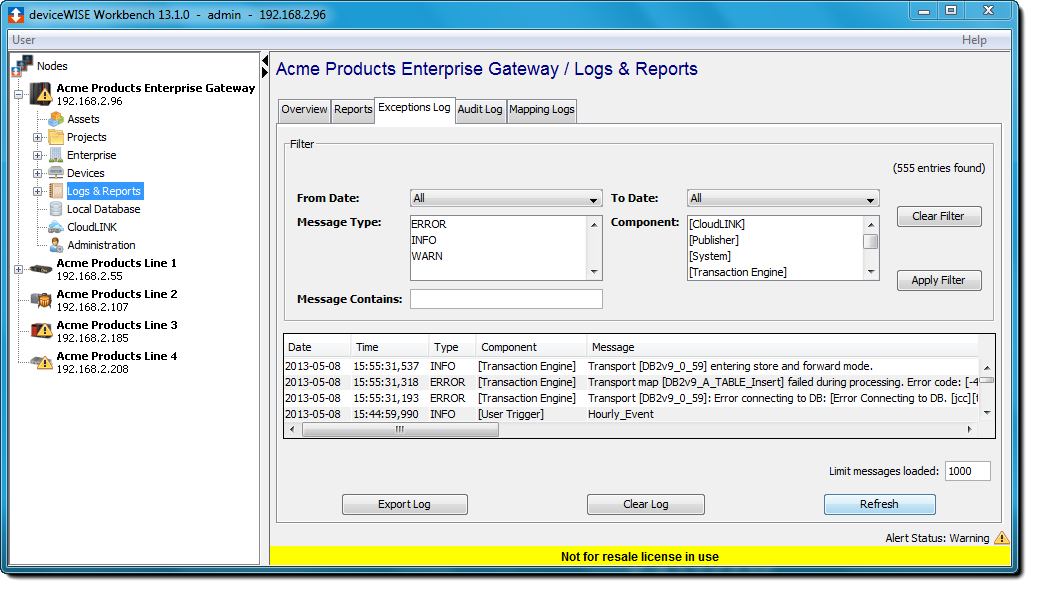
From the bottom of the Exceptions Log tab, select Refresh to view recent entries.
The Date and Time columns indicates the date and time, in the node's local time zone, that the log message was created.
The Type column indicates the level of the log message, which includes the following:
- FATAL
- WARN
- ERROR
- INFO
The Message column describes what caused the message to be written.
The columns can be reordered by dragging and dropping them to their new position. The entries can also be sorted by selecting a column heading.
You cannot delete individual messages from the Exceptions Log file.
Filtering the Exceptions Log entries
The Filter section allows the selection of filter
criteria to limit the number of entries that are
displayed.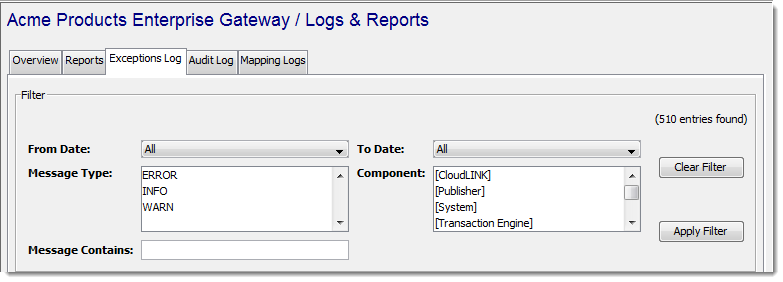
The From Date, To
Date, Message Type, and
Component parameters list the selections
that are available from the entries in the Exceptions Log.
The Message Contains parameter allows free
form text filtering.
After making the selections from these parameters, select
the Apply Filter button to apply the
filter to display only the entries that match the filter
criteria. The Clear Filter button clears
all selections and displays all entries.
The Limit messages loaded parameter at the lower right portion of the window indicates the number of entries to display. This can be useful if the node is accessed over a slow connection and only a limited number of the most recent entries are of interest.
Exceptions Log function buttons
The Exceptions Log tab buttons at the bottom of the window provide the following functions:
- Export - makes a copy of all of the entries for writing to a text file on the Workbench's computer.
- Clear Log - removes all entries from the Exceptions Log file.
- Refresh - refreshes the window to include any recent entries.