Node Overview
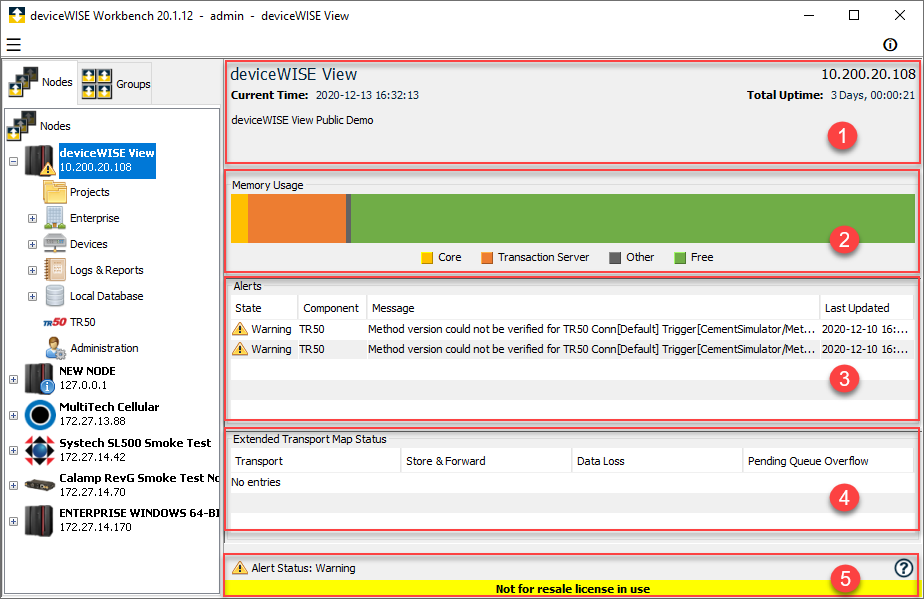
When a node is selected, the Workbench window displays details about the node in the right hand pane.

The parts of the Workbench window for this view are described in the following sections. The Title bar and Menu bar are the same as in the Nodes list view.
| Component | Description | ||||||||||||
|---|---|---|---|---|---|---|---|---|---|---|---|---|---|
 Node Summary Node Summary |
The node summary section includes the node name and description, the node's current time (taking into account the node's time zone), the node's IP address or TR50 thing key (depending on how the Workbench connected to the node), and the node's total uptime (the amount of time since the node was last started). | ||||||||||||
 Memory Usage
 |
The Memory Usage section displays the memory (RAM) usage of the runtime components and the amount of currently available free memory. This information is calculated from the memory available when the runtime is started, with those values being the baseline. The percentages are calculated relative to that baseline. This information is used to understand the relative increase in system resources as devices, triggers, transports and other runtime applications are defined and started. Hovering the mouse over the colored bar chart or the legend will display a popup with additional details. For another view of the system resource usage, see the System Administration -> Node Administration tab. | ||||||||||||
 Alerts
section Alerts
section |
The Alerts section displays a list of currently active alerts. For more information on the Alerts feature, see Node alert states. | ||||||||||||
 Extended Transport Map Status Extended Transport Map Status |
The Extended Transport Map Status section displays a list of the transport that have been or are in a Store and Forward state. Nodes that do not have the Enterprise connectivity feature will not have this section. For more information about the Transaction Server and the Store and Forward feature, see Enterprise connectivity. | ||||||||||||
 Notification ribbon Notification ribbon |
A colored notification ribbon will display the highest
level active notification for the selected node, if there
is an active notification. The notifications include:
|