When a trigger execution meets the trigger settings
reporting criteria, a trigger report is recorded in the
Reports Log. The Reports feature provides the detailed
viewing of the trigger reports and the configuration and
management of the Reports Log.
Viewing trigger reports
You can access a node's trigger reports as follows.
- From the Workbench left hand pane, expand the node
whose trigger reports you want to view.
- Select the Logs & Reports
icon.
- From the right hand pane, select the
Reports tab.
The Reports tab appears.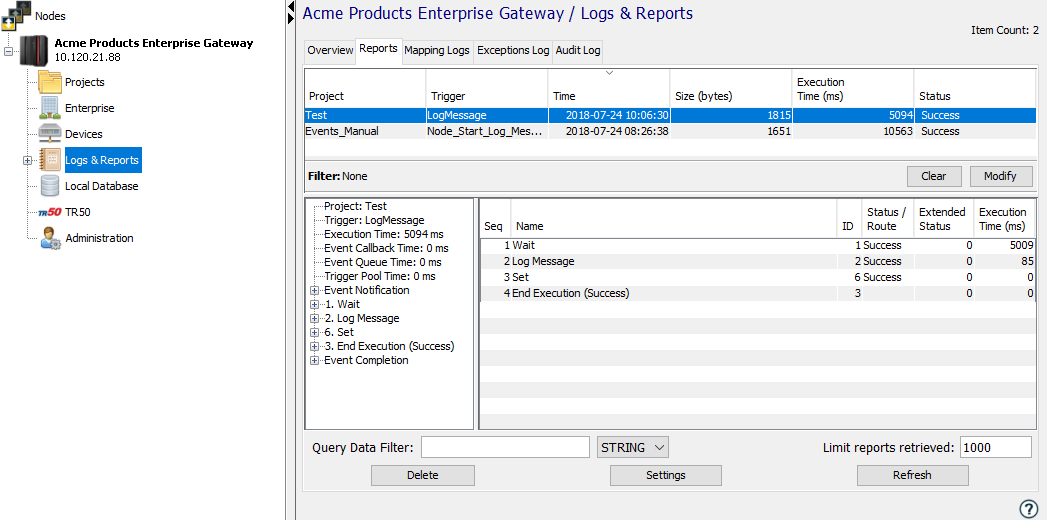
- From the bottom of the Reports
tab, select Refresh to view recent
entries.
- The Project and
Trigger columns indicate the trigger
that generated the report.
- The Time column indicates the date
and time, in the node's local time zone, that the
report was generated.
- The File Size (bytes) column
indicates the size of the report.
- The Execution Time (ms) column
indicates the total execution time of the
trigger.
- The Status column indicates the
ending status of the trigger
- The columns can be reordered by dragging and dropping them to their new position. The entries can also be sorted by selecting a column heading.
Viewing the details of a trigger report
When an individual report is selected from the top
portion of the Reports tab, the bottom
portion of the tab displays the details of the
report.
Since a report is generated for each trigger execution
instance that meets the trigger settings reporting
criteria, there can be multiple reports generated for a
given trigger.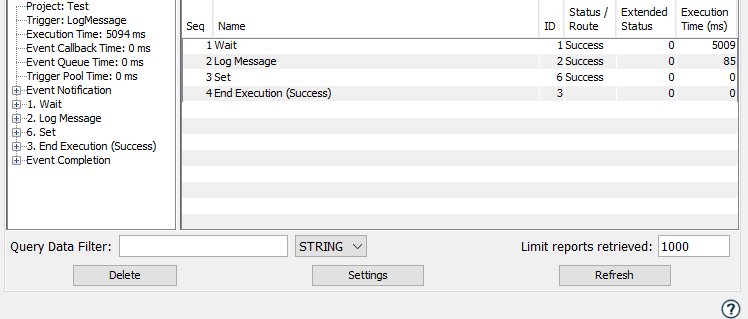
The left portion of the report details displays the execution summary including the total trigger execution time and the sequence of actions that were executed.
The right portion of the report details displays additional details about the actions. The columns are:
| Column | Description |
|---|---|
| Seq | The execution sequence number of the action. This is a sequential list. |
| Name | The name of the action. |
| ID | The action identifier. When using
the List Editor, the action IDs are
included in the list of actions. When
using the Canvas Editor, the action ID
is displayed in each action
block. While the Seq number is sequential, the action ID indicates the execution path and shows how the routing, including For loops, If actions, and other branching progressed through the trigger's actions. |
| Status/Route | The route that was taken from the action in determining the next action to execute. |
| Extended Status | The result of the action. |
| Execution Time (ms) | The time to execute the action in milliseconds. The sum of the action execution times and the internal queuing times will be the overall trigger execution time displayed in the left portion of the report details. |
Trigger execution time
A trigger's execution time includes the sum of the trigger's actions' execution times, and the internal trigger instance creation and queuing times.
The times included at the top left section of the trigger report detail can include significant time that indicates how the system is performing.
- Event Callback Time, Event Queue Time, and Trigger
Pool Time are times for the trigger event creation and
internal queuing. These values should normally be
zero.
If your trigger reports show significant times for these 3 values, your application may benefit from an alternative thread pool implementation. For more information, see the Thread Pool V2 topic in Runtime thread pool configuration. - Trigger Queue Time is an indication of the trigger instance being queued before being executed, based on the Trigger Settings values for Max In Progress and Queue Size. For more information, see Trigger settings.
Expanding the report execution summary
The actions listed in the left portion execution summary can be expanded to show additional details, including any input and output parameters. Individual actions and expanded or collapsed using the [+] and [-] icons next to the actions.
Other options are available by selecting an action in
the left hand pane, then right click to display a pop-up
menu: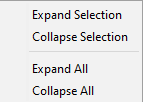
When an action and all of its inputs and outputs are
expanded, the details are displayed including the data
values of the parameters. For the example of the
Wait action, the input parameter for the
time to wait in milliseconds was a constant with a value of
5000. This is displayed next to the Data
item along with the display in individual bytes in
hexadecimal. The byte values 00 00 13 88 in hex is 5000 in
decimal.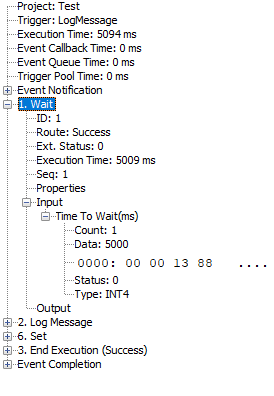
Some input values that are selected from lists may not be have their value displayed in the expanded details for the input and output parameters.
As your trigger's are developed and debugged, the trigger report feature will aid in understanding the run time execution of a trigger, including the data values used, the success or failure of each action and the execution route.
Report limits
While the trigger reporting feature is very useful in understanding the run time behavior of trigger execution instances, it does add overhead to the system's execution.
Since the final outcome of a trigger's execution (success, failure, execution time) can not be predetermined, the generation of the trigger report must take place as the trigger progresses through its actions. This means that for all trigger settings reporting options other than Off, the overhead to generate the report takes place before the final execution results determine whether to write the report to the Reports Log or discard the trigger report. If the report is written to the Reports Log, then that is additional overhead to the system's execution.
For nodes that have limited resources (CPU, memory, disk), this overhead can be significant.
The reporting feature does have restrictions built in to limit the number of trigger reports that are generated and written to the Reports Log. When these limits are reached, additional trigger reports are not generated until the pending reports are processed and written to the Reports Log.
Care should be taken when specifying the reporting option for triggers, based on the need for the additional information, the frequency of the execution of the triggers, and the availability of system resources on the node.
Advanced Queries
The Query Data Filter field allows for advanced querying of data within reports. Values are case sensitive. The primary search focus is on values in data elements - values which show a data value and raw bytes in the report. For example, "Time To Wait(ms)" in the report above.
When searching for values within data elements, the value must match exactly and the element data type must be specified correctly. Searching for a number as an INT1 will not yield the same results as searching for it as an INT4 due to the number of bytes used for storage.
Additionally, a string search will also be done on the query text in non-data elements. For example, you can search on an Event Notification type or an Event Completion status code.
To limit a search to specific data elements only, specify the element label and the data value. For example, searching Time To Wait(ms)=5000 with type INT4 will match the above report. Both the label and the value must be exact.
The color of this field will change depending on certain conditions:
- Default - filter is not being applied on the current query.
- Yellow - value changed but not yet applied. Hitting enter key or the Refresh button will attempt to apply.
- Green - current value is being used as a filter.
- Red - Value entered not valid for the data type selected (e.g. using 422142 for an INT1), filter not applied.
Settings
The Reports tab
Settings button is used to configure the
Reports Log: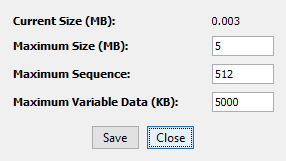
The parameters are:
| Parameter | Description |
|---|---|
| Current Size (MB) | The current size of the Reports log in megabytes. |
| Maximum Size (MB) | The maximum size that the Reports Log will reach. Once this size is reached, older report entries are discarded. |
| Maximum Sequence | The maximum number of sequential actions that will be part of a report. The sequence of actions can reach large numbers when there are branching actions, such as For and If, and the routing criteria to end the execution of the trigger is not met. |
| Maximum Variable Data (KB) | The maximum amount of data, in kilobytes, that will be displayed for a variable within the report. For variables that are arrays, this value indicates the maximum number of elements in the array that will be written to the report. For variables that are String or Binary data types, this is the maximum number of bytes that will be written to the report for the variable. |
For each trigger, the Trigger settings Reporting parameter is used to configure the use of the trigger reporting feature. Some node types may not have all options available.
Independent of the Reporting parameter and the trigger's success or failure completion, a trigger report can be generated for the next trigger execution instance using the pop-up menu for the trigger. For more information, see the Generate Report option.
In addition to each trigger's setting of the Reporting parameter, there is a node wide Trigger Reporting parameter available in System administration > Diagnostics to disable the generation of all trigger reports. This setting can be used as an alternative to changing all triggers' settings for the Reporting parameter to Off.
When an individual report is selected from the top
portion of the Reports tab, a shortcut menu
is displayed when you right-click on a particular project.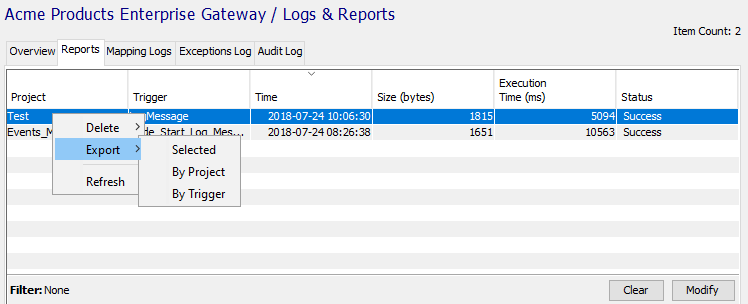
The options available are:
| Option | Description |
|---|---|
| Delete | The options to delete report entries
are: Selected - the selected triggers (Shift-click, Crtl-click or Crtl-A to select multiple entries). By Project - all report entries from triggers in the selected project. By Trigger - all report entries from the selected trigger. All - all report entries. |
| Export | The selected report entries are
exported to a text file on the
Workbench's computer. The options to export report entries are: Selected - the selected triggers (Shift-click, Crtl-click or Crtl-A to select multiple entries). By Project - all report entries from triggers in the selected project. By Trigger - all report entries from the selected trigger. |
| Refresh | Refresh the Reports tab with recent additions. |
Event variable is not serviced
The system provides a trigger output event variable, ResultStatus, as a means to pass information from a "called" trigger back to the "calling" trigger for some trigger event types.
If this ResultStatus output event variable is not set in the trigger (using any action that can populate the output event variable, such as the Set action), then the trigger report will show for the ResultStatus event variable:
-5109 "Event variable is not serviced"
This trigger report information is not indicating the trigger ended in error, rather it is indicating that this system provided output event variable has not been set.