The Diagnostics tab is used to perform
node diagnostic tasks, including testing network
connectivity, enabling enhanced logging, controlling
trigger execution, controlling trigger report generation
and more.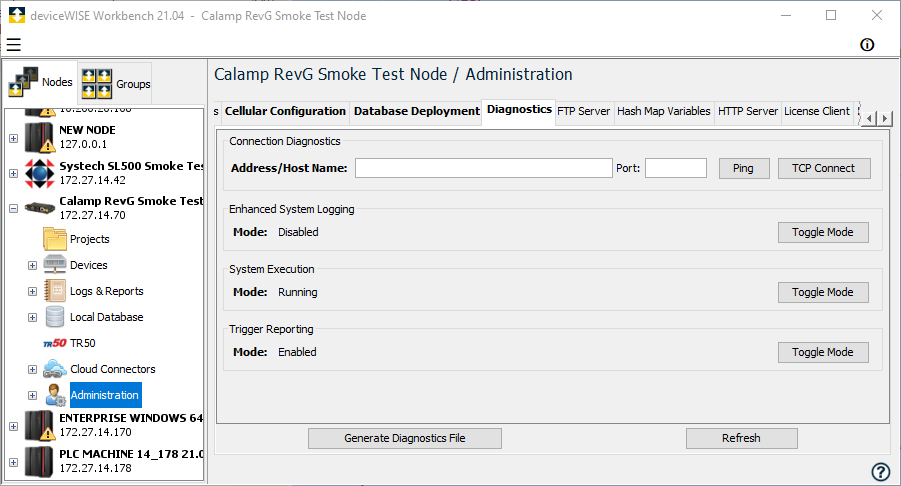
The diagnostic functions available on a node depend on the product install on the node, some functions may not apply to a specific product type.
Connection Diagnostics
The Connection Diagnostics section allows you to test the node's ability to connect to another computer over the network. This will help to understand if an application problem is caused by an underlying network problem.
Node Connection Diagnostics
The Connection Diagnostics commands are issued from the node, not from the computer that is running the Workbench.
Ping
The Ping function is used to test basic network connectivity to another computer.
Enter an IP address or a host name into the Address/Host Name parameter and then select Ping. The results of the network Ping will be displayed.
Examples of using the Ping function include:
- A node's IP address to see if the node is started and has basic network connectivity.
- The deviceWISE Cloud's URL (default m2m.devicewise.com) to see if the deviceWISE Cloud is reachable, including Domain Name System (DNS) server and network routing elements.
- A device's IP address to see if the physical device is started and has basic network connectivity.
TCP Connect
The TCP Connect function is used to test connectivity to the runtime on another node.
Enter an IP address or a host name into the Address/Host Name parameter, a port number into the Port parameter (default 4012) and then select TCP Connect. The results of the TCP connect will be displayed.
Connection troubleshooting
If there are problems with a nodes ability to connect to other nodes or computers, review the following topics:
- Network Configuration for the node's configuration parameters for: DNS Server, Adapters, and Default Gateway. Some products do not have a network configuration feature, and user's must rely on the operating system's utilities or configuration functions. A node's firewall feature may need to be reviewed and updated to allow the system's runtime access.
- Time Management for the node's time and time zone parameters. Some network connectivity problems may be related to these parameters not being configured properly and security certifications dates of issue.
Enhanced System logging
The Enhanced System Logging section has a current mode, which normally is Disabled, and a Toggle Mode button. Selecting the button will toggle the current mode between Disabled and Enabled.
- When Disabled, the default level of log messages are written to the internal system debug logs.
- When Enabled, additional log messages are written to the internal system debug logs. Use of this function is normally when you are involved with technical support personnel in investigating a problem or question.
Since additional processing is required when enabled, normal operation should leave the mode Disabled.
System Execution
The System Execution section has a current mode, which normally is Running, and a Toggle Mode button. Selecting the button will toggle the current mode between Running and Suspended.
- When Running, the normal execution of triggers, data mappings, the data publisher and the Transaction Server takes place.
- When Suspended, the trigger
execution and data mappings are not scheduled and
executed. The Transaction Server will not receive any
new transactions from triggers, since they are not
executing, but the Transaction Server will process any
transactions in a transport's Store and Forward queue.
Individual transports can be suspended and resumed
using the functions on the Transports tab or from
triggers using the Control Transport State
action.
A blue notification ribbon indicating that the system execution is suspended will be displayed at the bottom of the right hand pane. - If the node has entered safe mode during node start up processing, the mode will be Safe and an aqua notification ribbon indicating that the node is running in safe mode will be displayed at the bottom of the right hand pane. Safe mode can be exited by selecting the Toggle button and changing to Running mode.
A node's execution can be suspended as part of troubleshoot an application. The node's resources and logs can be accessed without the overhead, and possible overload, of the triggers executing. Log files can be exported and a diagnostics file can be generated as part of the troubleshooting process.
Trigger Reporting
The Trigger Reporting section has a current mode, which normally is Enabled, and a Toggle Mode button. Selecting the button will toggle the current mode between Enabled and Disabled.
- When Enabled, trigger reports are generated and written to the Reports Log based on each triggers' settings.
- When Disabled, all trigger reports are not generated and are not written to the Reports Log.
This system wide trigger reporting "override" can be used if the trigger reports are effecting a node's performance, before reviewing and changing the triggers' settings.
Since the final outcome of a trigger's execution (success, failure, execution time) can not be predetermined, the generation of the trigger report must take place as the trigger progresses through its actions. This means that for all trigger settings reporting options other than Off, the overhead to generate the report takes place before the final execution results determine whether to write the report to the Reports Log or discard the trigger report. If the report is written to the Reports Log, then that is additional overhead to the system's execution.
Care should be taken when specifying the reporting option for triggers, based on the need for the additional information, the frequency of the execution of the triggers, and the availability of system resources on the node.
Run/Stop Switch Behavior
The Run/Stop Switch Behavior section, available on MESInterface IT nodes, has a current mode, which normally is Ignore switch setting, and a Toggle Mode button. Selecting the button will toggle the current mode between Ignore switch setting and Suspend on start when switch set to stop.
- When Ignore switch setting, the node will complete node start up processing without interrogating the CCPU's Mode switch.
- When Suspend on start when switch set to stop, during node start up processing the CCPU's Mode switch will be interrogated. If the Mode switch is set to Stop, then the node will enter safe mode. If the Mode switch is set to Run, then the node will continue with normal start up processing.
For MESInterface IT nodes, the start up processing and whether safe mode is entered, can be controlled by this parameter and the physical Mode switch on the CCPU. This can be used when troubleshooting an application or if there is another reason to not have system execution transition directly to Running as part of node start up.
Generate Diagnostics File
The Generate Diagnostics File button is used to have the node collect a set of configuration and log files into a compressed diagnostics file. The diagnostics file is either stored in the node's Staging Browser or is available to directly save to the Workbench computer's file system.
The diagnostics file is one of the items that the technical support team may request as part of investigating a problem or question.
If you have a scenario where you are directly connected
to the node, such as a Windows command prompt or a
Linux/AIX SSH/Telnet session, you could generate a
diagnostic file using a .cmd or .sh file.
This diagnostic file will not include the most current
audit.log and exception.log text files, which are extracted
from their database tot he text file as a precursor step.
The generated diagnostic file is placed in the Staging
Browser area of the node:
- For Windows based systems: C:\Program Files\deviceWISE\Gateway\gendbg.cmd
- For Linux or AIX based systems, generally: /opt/dw/gendbg.sh
Properties
Some configurable features of the runtime are controlled
by defining properties in one of the properties files. For
more information, see Properties file
management.
| Property | Description |
|---|---|
| debug.gen.onboot | Controls the generation of a
diagnostic file when the system starts.
By default, this property is not
included in the property file, and
therefore a diagnostic file is not
generated when the system starts.
Setting this property to a value other
than 0 indicates that a diagnostic file
should be generated on system start and
that the number of diagnostic files
should be kept before overwriting older
files. For example: debug.gen.onboot=3, will cause a diagnostic file to be generated when the system starts and that the 3 most recent files will be kept. The diagnostic files are created in the runtime's staging browser area of the node. This feature is not supported on products that do not generate the diagnostic file in the staging browser area of the node, but rather save the file to the Workbench computer's file system:
|
Related topics