Step 4 - Viewing the received WebSphere MQ messages
You can validate that the example trigger is working correctly by changing the values in the PLC device variables to values you recognize. When the trigger executes, reads the variables from the device and sends the values in a message to the WebSphere MQ data queue, you will see the values in the WebSphere MQ message window.
Assumptions
The following is assumed:
- You have completed Step 3 - Defining a trigger to send data to a WebSphere MQ queue.
- You have access to the WebSphere MQ Explorer.
Changing the values of the device variables
You can change the values in the PLC device variables
and see those new values in the messages sent to the
WebSphere MQ data queue.
Note that this example is using a device that represents a
physical PLC. You should be aware of the implications of
changing the value of device variables in your environment.
This example could be followed using a device that works
best in your environment.
Follow these steps:
- From the Workbench left pane, expand
Devices, and then select the
Variables icon.
The Variables tab appears as the right pane. - Expand the Local CPU 1 device, and
then expand the D variables.
- Select D[0], right-click to
display its pop-up menu, and then select the
Write as and select
STRING.
The Write window appears.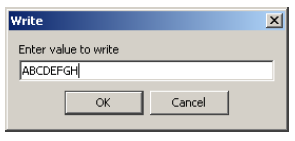
- Enter ABCDEFGH, and then select
OK. The string is written to the
D[0] device variable.
- Repeat steps 1 to 4 for D[4], D[6], and D[8], assigning the appropriate data type for each device variable. Refer to Summary example device variables and map variables Step 2 - Defining a transport map for the WebSphere MQ transport.
Starting the Trigger
In order to send data to the WebSphere MQ queue, you must manually start the trigger. After the trigger executes, a message appears in the queue that shows the values that you wrote to the PLC device variables.
Follow these steps:
- From the Workbench left pane, expand the node that
contains the project whose trigger you want to
start.
- Expand the Projects icon, and then
select the appropriate project.
- If necessary, start the project.
The project tab appears as the right pane.
- Right-click the appropriate trigger to display its
pop-up menu, and then select
Start.
The State column for the trigger changes to Started.
The Successes column indicates the number of successful executions of the trigger. If the trigger has a problem during its execution, the Failures column value will be incremented.
For a successful trigger, a message should appear every 5 seconds in the WebSphere MQ queue.
Viewing the messages in the queue
Now that the trigger is executing, you can view the messages in the queue using the WebSphere MQ Explorer.
- From the Windows Start menu, click
All Programs >IBM WebSphere MQ >WebSphere
MQ Explorer.
The WebSphere MQ window appears.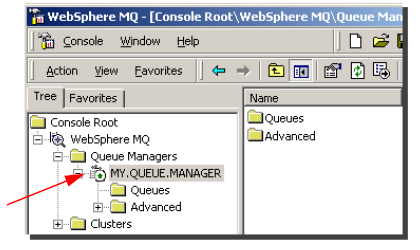
- From the left pane, expand the Queue
Managers folder, and then select the queue
manager. For this example
MY.QUEUE.MANAGER.
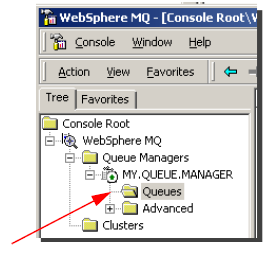
- Under the queue manager, select the
Queues folder.
A list of all the queues for the selected queue manager appear in the right pane.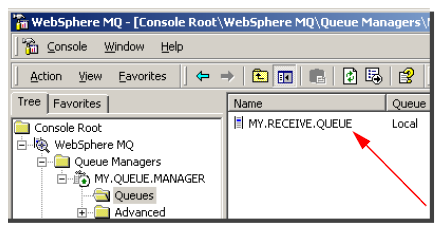
- Double-click the name of your queue. For this
example, MY.RECEIVE.QUEUE.
The Message Browser window appears with a list of all the available messages on the queue. In this case, there will be one message for each successful execution of the trigger. - Double-click one of the messages.
A Properties for Message window appears.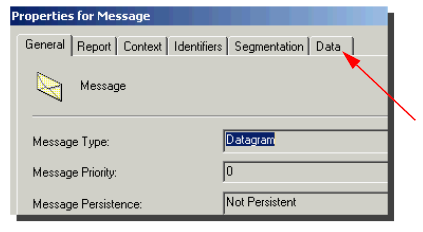
- Select the Data tab to display the
message data.
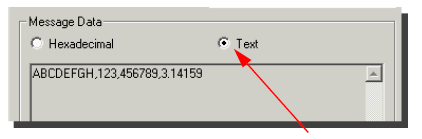
- Click the Text option to view the ASCII data in the message.
The message contains the values read by the trigger from the Local CPU 1 device variables and sent by the trigger using the transaction action, the transport map and transport.
You can repeat the steps to change the values of the
variables, which will be read by the trigger and sent in a
message to the WebSphere MQ data queue.
The trigger was defined as a scheduled trigger to execute
every 5 seconds, so a new messages will appear every 5
seconds until the trigger is stopped.