While Viewing a Thing, you will see all the properties associated with the Thing. To view a property of a Thing, follow the procedure below:
- Click on the property you
want to view while Viewing a Thing
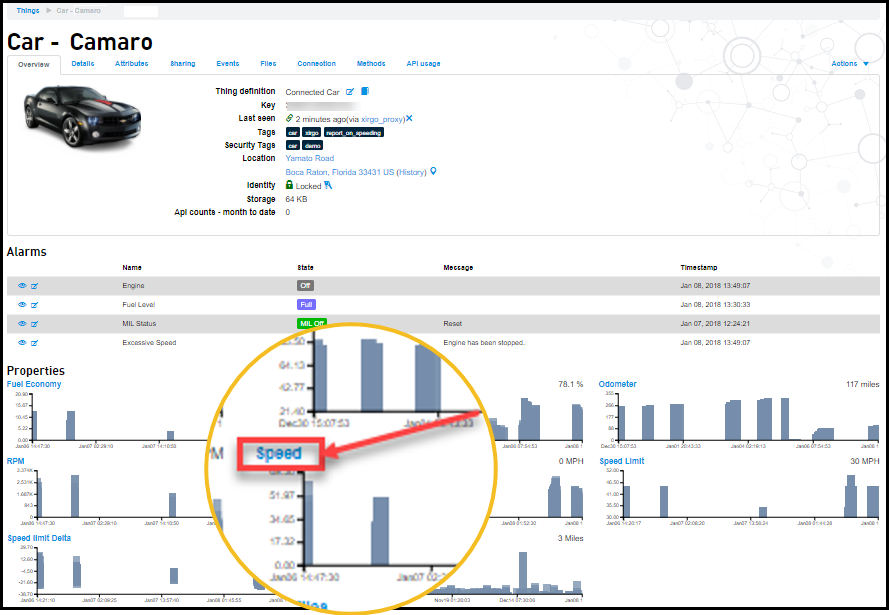
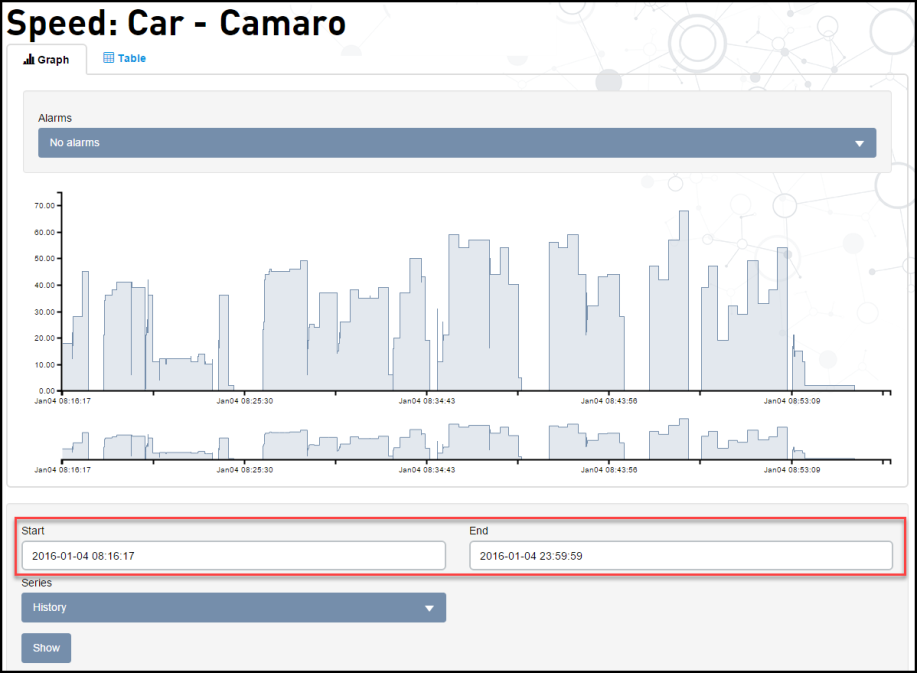
The Property page appears with the graph. For more information on changing the graph, see Defining Properties. - Select the date range to view more historical
data
- Click the Series drop-down to
view the aggregated data. It is possible to view
the data aggregates (hourly or
Daily) with seven different options
- Average, Weighted Average,
Non-zero time
weighted average, Sum, Max, Min, and
Count.
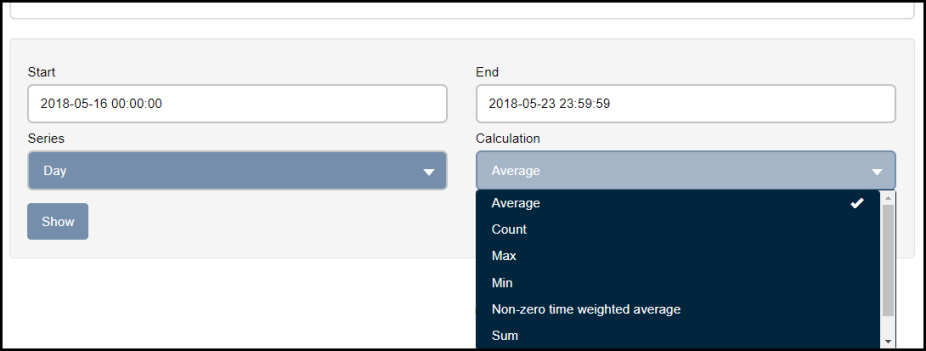
The aggregate data is available only when Calculate aggregates set TRUE while creating a Thing definition. For more information on Calculate aggregates, see Defining Properties.
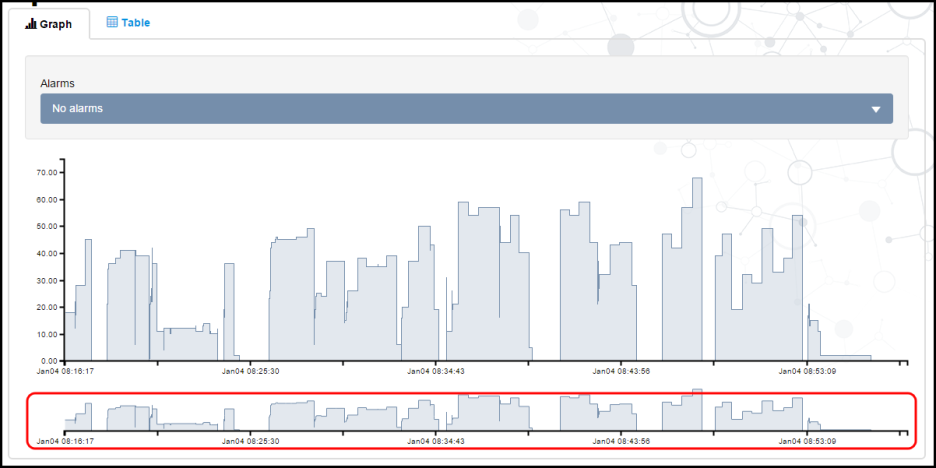
- On the Graph tab, you can zoom in
and out with the scroll wheel, click-and-drag on the
sub-chart to highlight a range, and click-and-hold the
highlighted range to scrub across the chart.
- To view the alarms, click on the
Alarms drop-down and select
an alarm.
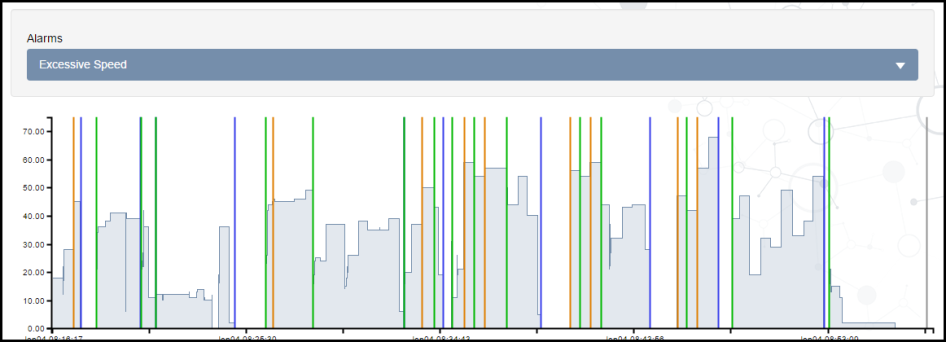
The alarms are displayed as vertical lines in the chart. - The Table tab shows you the series information in
table format.
To download the table information as a CSV file, click on the Download CSV link.