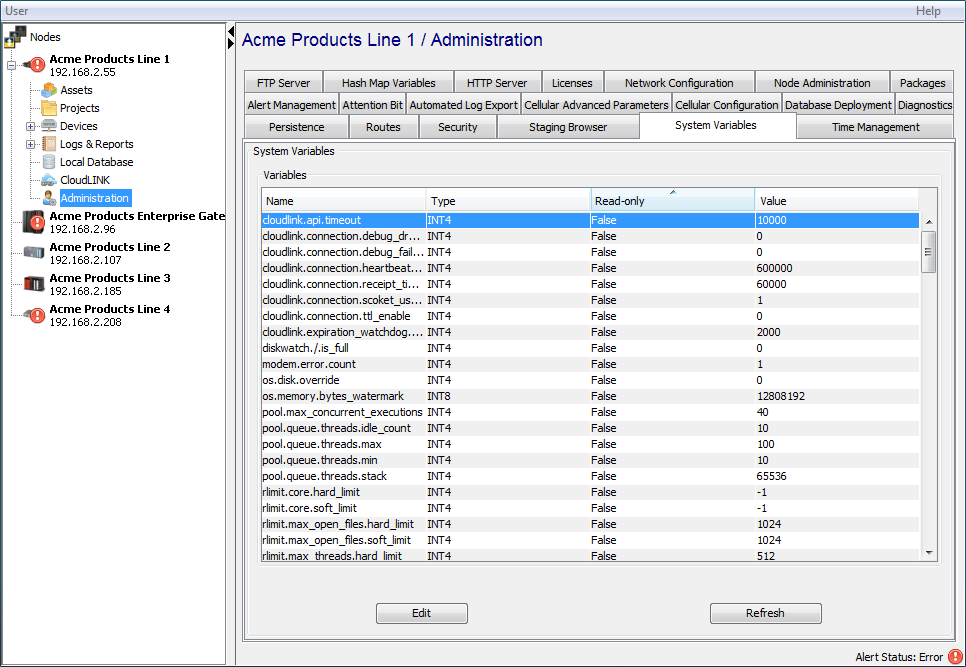
The System Variables tab is used to
view the internal system variables of the system for
debugging purposes. You can also export the data for
debugging purposes and update the values of some
variables.
The system variables in a node vary depending on the type of product installed, the packages or extension added to the node and system configuration properties.
Some node types allow the update of certain system variables, as indicated by the Read-only column. Others do not allow the update of system variables and do not display the column.
Viewing the system variables
The system variables provide a view into the internal function of a node. The understanding of the variables, their values and the implications are advanced topics. You may be asked to view or record values of specific system variables when troubleshooting a problem or question.
The columns are sortable, by selecting the column heading. The columns can also be reordered by dragging and dropping to a new position in the table.
The trigger action System Variable Get allows the reading of a system variable in your application logic.
Exporting the system variables
The system variables can be exported to a comma-separated values (CSV) file as part of troubleshooting a problem or question.
To export the system variables, right click on any portion of the system variables table and select Export Data. A file dialog will be displayed, allowing to select the file location and name for the CSV file.
Updating system variables
Some node types allow the update of certain system variables, as indicated by the Read-only column. If the column is displayed, the system variables that have a Read-only column value of False can be updated.
Updating system variables
Changing system variable values is advanced
functionality.
Incorrect settings may result in the node becoming
unresponsive and unrecoverable.
To update a system variable that is not Read-only,
double click the variable.
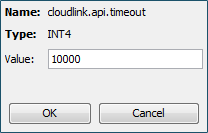
An Edit System Variable window is displayed:
Enter a value and select OK.
The new value will be displayed in the system variables table.
Example system variables
The system variables in a node vary depending on the
type of product installed, the packages or extension added
to the node and system configuration properties. The
following provides an example of system variables that you
might encounter:
| System variable name | Description |
|---|---|
| device.loader.suspend |
Controls the watchdog attempting to
restart disabled devices.
|
| device.count | The number of defined devices. |
| device.license.in_use | The number of active device licenses currently being used. This includes started devices and connections to server or listener type devices. |
| device.license.rejected | The number of connections rejected by a server or listener type device because an active device license was not available. This value is incremented for each rejected connection and is reset when the node is re-started. |
| device.license.total | The total number of active device licenses summed from all Device Manager licenses. |
| device.started.count | The number of started devices. This count does not include Aliases devices, Global Variables or Property devices, as they are not included in the active device license requirement. The Sysmon package and Local I/O drivers for specific gateways do not require a device license. |
| hardwareid.guid | The Linux GUID for Linux based gateways that have dmi support from the BIOS |
| http.license.in_use | http.license.in_use - The current number of licenses in use. This is the same value displayed in the Acquired License Count parameter. For more information on HTTP API Server Licenses, see HTTP Server. |
| http.license.rejected | The number of license requests that have been rejected. |
| http.license.total | The total number of licenses available. This includes the four system provided licenses and any added (and valid) HTTP API Server licenses. |
| license.days_remain license.emergency_count license.expired_count license.valid_count |
The license.XXX variables display
information about the node's
licenses. When all of the node's licenses have an Expiration of <None>, the days_remain value will be 2147483647 - the maximum value for an INT4 For related information, see Licenses. |
| melco.qbfevent.cpu1.count | Internal. |
| melco.qbfevent.cpu2.count | Internal. |
| melco.qbfevent.cpu3.count | Internal. |
| module.name | The name of the node, accessed from the Node Administration tab. |
| module.description | A description of the node, accessed from the Node Administration tab. |
| module.status | The current status of the node. The
value depends are the status of several
items, with the precedence order as
described below:
|
| module.suspend | This is set to true when system execution is suspended. |
| network.adapter.smsc0.gateway | The current gateway assigned to the specific adapter. In this case, adapter smsc0. |
| network.adapter.smsc0.ip | The current IP address assigned to the specific adapter. In this case, adapter smsc0. |
| network.adapter.smsc0.netmask | The current netmask assigned to the specific adapter. In this case, adapter smsc0. |
| os.cpu.usage | The percentage of the CPU utilization. Zero means the CPU is idle. |
| os.disk.DRIVE_0 | Internal. |
| os.memory.bytes_free | Available memory in bytes for the runtime components. |
| os.memory.bytes_total | Total memory allocated in bytes for the runtime components. |
| os.memory.bytes_used | Current used memory in bytes for the runtime components. |
| os.memory.bytes_watermark | The maximum value of os.memory.bytes_used since the runtime components were started. |
| os.memory.kernel.free | Internal. |
| os.memory.usage | The percentage of the memory utilization. System failure will occur when the percentage reaches 100. |
| pool.0.executing | Internal. |
| pool.1.executing | Internal. |
| pool.2.executing | Internal. |
| pool.3.executing | Internal. |
| pool.4.executing | Internal. |
| pool.5.executing | Internal. |
| pool.6.executing | Internal. |
| pool.7.executing | Internal. |
| pool.8.executing | Internal. |
| pool.9.executing | Internal. |
| pool.max_concurrent_executions | Internal. |
| pool.queue.depth | The number of work items that are waiting to be processed. If the number increases continuously over a period of time, the system might become overloaded. For more information, see: Troubleshooting node resource utilization problems and Runtime thread pool configuration. |
| pool.XXXX | For more information on the pool.XXXX system variables and the configuration of properties, see: Troubleshooting node resource utilization problems and Runtime thread pool configuration. |
| pool.work_items_per_minute | Internal. |
| process.memory.usage | Internal. |
| publisher.prio[X].current_miss_ count | Internal. |
| publisher.prio[X].iteration_count | Number of iterations data publisher had run. The data event is evaluated based on data publisher. The number should increase by 1 every invocation, which is defined by the priority of the event. X represents the level of priority: 1=50 milliseconds, 2=200 milliseconds, 3=500 milliseconds, 4=1000 milliseconds. |
| publisher.prio[X].last_time | The work time in millisecond spent on the last invocation of the data publisher. |
| publisher.prio[X].miss_count | Number of iterations a data publisher had missed. The data publisher might miss some iterations when the system is being overrun. When the number continuously increases, reduce the system load in order to maintain the integrity of the data publisher. |
| publisher.prio[X].miss_percent | Number of iterations a data publisher had missed represented in percentage. |
| schedule.periodic.cycle_iteration_count | Number of iterations a periodic timer had run. The periodic schedule event is triggered based on the periodic timer. The number should increase by 1 every invocation or every periodic interval (schedule.periodic.interval) in millisecond, which is predefined by the system. |
| schedule.periodic.cycle_last_time | The work time in millisecond spent on the last invocation. |
| schedule.periodic.cycle_miss_count | Number of iterations a periodic timer had missed. The periodic timer might miss some iterations when the system is being overrun. When the number continuously increases, reduce the system load in order to maintain the integrity of the periodic timer. |
| schedule.periodic.cycle_miss_percent | Number of iterations a periodic timer had missed represented in percentage. |
| schedule.periodic.cycle_overrun_count | Internal. |
| schedule.periodic.interval | The interval between invocation of the periodic timer. |
| system.platform_name | The platform name of the hardware which the system is running on. |
| system.startup.time | Internal. |
| trans.jvm.freeHeap | Internal. |
| trans.jvm.totalHeap | Internal. |
| trans.memory.usage | Internal. |
| triggers.loader.suspend |
Controls the watchdog attempting to
restart disabled triggers.
|