The Thing Dashboard shows a pie chart with a quick
overview of connected things, a table of recently added
things and event logs. It also displays the tags for quick
filtering. 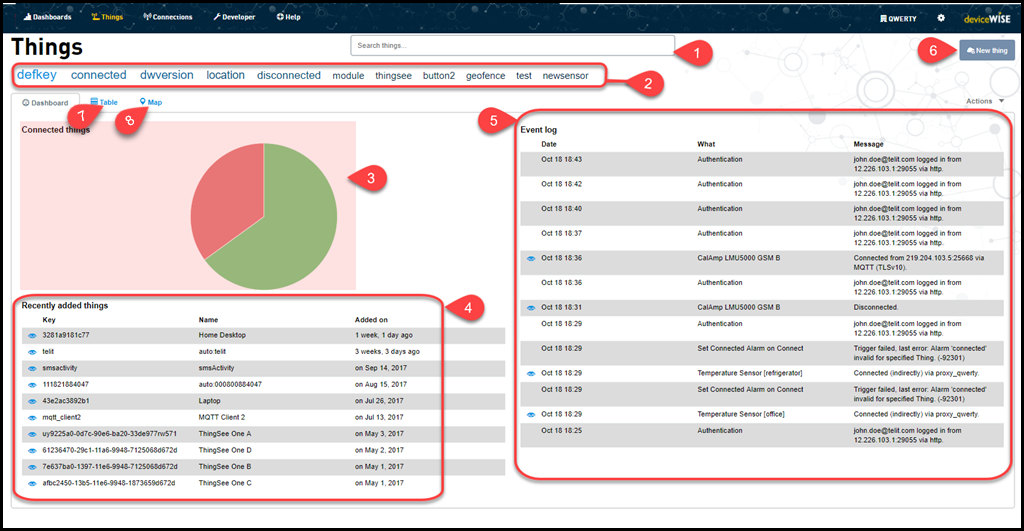
| Item | Description |
|---|---|
| 1 | Search in the Things dashboard allows you to do a full-text search. Enter the text and press enter to find all the things that contain the entered text. |
| 2 | Tags for quick filtering. Switch to the Table tab to view the filtered Things. For more information, see Using Tags. |
| 3 | The connected things pie chart displays a glimpse of the number of things that are currently connected. |
| 4 | Recently added things
display the recently added things. Click on
the corresponding view icon  of a thing you want to display.
 |
| 5 | Event log displays
recent event log entries. Event log entries
for things will have a view icon
that, when clicked, displays the thing's
overview page. |
| 6 | The New Thing button is used for Creating Generic thing, Creating LWM2M thing and Creating a Telit module |
| 7 | The Table tab displays a table of
all the Things. It contains
Last Seen and
Last Communication
columns. The Last Seen column displays the last date and time that a Defining Properties, Defining Attributes, or Defining Locations value was published for a thing. This publish may be made directly by the thing, indirectly by a proxy, indirectly by RADIUS packet or even a user. The Last Communication column will contain the same value as the the Last Seen column if the device is not in session. If the device has an active Sessionsthe Last Communication field will contain the last time the device established a session or extended the validity of the session. |
| 8 | The Map view displays a map with the
geographical location of Things. The colored circles with a number in them are marker clusters. These clusters are based on each pins reported location and it's proximity to other pins scaled by the map zoom level. The color is a default at-a-glance indication of the cluster size. The default colors are a shade of green, yellow, and red. The boundary's between colors are the marker counts 10 and 100.
As you zoom into larger clusters they will get separated into smaller clusters until the max zoom limit is reached. At that point clicking on the marker cluster will spider out the remaining pins around a central point. |